RFR: 8265029: Preserve SIZED characteristics on slice operations (skip, limit) [v3]
Tagir F.Valeev
tvaleev at openjdk.java.net
Sat Apr 17 02:19:35 UTC 2021
On Sat, 17 Apr 2021 01:55:26 GMT, Tagir F. Valeev <tvaleev at openjdk.org> wrote:
>> With the introduction of `toList()`, preserving the SIZED characteristics in more cases becomes more important. This patch preserves SIZED on `skip()` and `limit()` operations, so now every combination of `map/mapToX/boxed/asXyzStream/skip/limit/sorted` preserves size, and `toList()`, `toArray()` and `count()` may benefit from this. E. g., `LongStream.range(0, 10_000_000_000L).skip(1).count()` returns result instantly with this patch.
>>
>> Some microbenchmarks added that confirm the reduced memory allocation in `toList()` and `toArray()` cases. Before patch:
>>
>> ref.SliceToList.seq_baseline:·gc.alloc.rate.norm 10000 thrpt 10 40235,534 ± 0,984 B/op
>> ref.SliceToList.seq_limit:·gc.alloc.rate.norm 10000 thrpt 10 106431,101 ± 0,198 B/op
>> ref.SliceToList.seq_skipLimit:·gc.alloc.rate.norm 10000 thrpt 10 106544,977 ± 1,983 B/op
>> value.SliceToArray.seq_baseline:·gc.alloc.rate.norm 10000 thrpt 10 40121,878 ± 0,247 B/op
>> value.SliceToArray.seq_limit:·gc.alloc.rate.norm 10000 thrpt 10 106317,693 ± 1,083 B/op
>> value.SliceToArray.seq_skipLimit:·gc.alloc.rate.norm 10000 thrpt 10 106430,954 ± 0,136 B/op
>>
>>
>> After patch:
>>
>> ref.SliceToList.seq_baseline:·gc.alloc.rate.norm 10000 thrpt 10 40235,648 ± 1,354 B/op
>> ref.SliceToList.seq_limit:·gc.alloc.rate.norm 10000 thrpt 10 40355,784 ± 1,288 B/op
>> ref.SliceToList.seq_skipLimit:·gc.alloc.rate.norm 10000 thrpt 10 40476,032 ± 2,855 B/op
>> value.SliceToArray.seq_baseline:·gc.alloc.rate.norm 10000 thrpt 10 40121,830 ± 0,308 B/op
>> value.SliceToArray.seq_limit:·gc.alloc.rate.norm 10000 thrpt 10 40242,554 ± 0,443 B/op
>> value.SliceToArray.seq_skipLimit:·gc.alloc.rate.norm 10000 thrpt 10 40363,674 ± 1,576 B/op
>>
>>
>> Time improvements are less exciting. It's likely that inlining and vectorizing dominate in these tests over array allocations and unnecessary copying. Still, I notice a significant improvement in SliceToArray.seq_limit case (2x) and mild improvement (+12..16%) in other slice tests. No significant change in parallel execution time, though its performance is much less stable and I didn't run enough tests.
>>
>> Before patch:
>>
>> Benchmark (size) Mode Cnt Score Error Units
>> ref.SliceToList.par_baseline 10000 thrpt 30 14876,723 ± 99,770 ops/s
>> ref.SliceToList.par_limit 10000 thrpt 30 14856,841 ± 215,089 ops/s
>> ref.SliceToList.par_skipLimit 10000 thrpt 30 9555,818 ± 991,335 ops/s
>> ref.SliceToList.seq_baseline 10000 thrpt 30 23732,290 ± 444,162 ops/s
>> ref.SliceToList.seq_limit 10000 thrpt 30 14894,040 ± 176,496 ops/s
>> ref.SliceToList.seq_skipLimit 10000 thrpt 30 10646,929 ± 36,469 ops/s
>> value.SliceToArray.par_baseline 10000 thrpt 30 25093,141 ± 376,402 ops/s
>> value.SliceToArray.par_limit 10000 thrpt 30 24798,889 ± 760,762 ops/s
>> value.SliceToArray.par_skipLimit 10000 thrpt 30 16456,310 ± 926,882 ops/s
>> value.SliceToArray.seq_baseline 10000 thrpt 30 69669,787 ± 494,562 ops/s
>> value.SliceToArray.seq_limit 10000 thrpt 30 21097,081 ± 117,338 ops/s
>> value.SliceToArray.seq_skipLimit 10000 thrpt 30 15522,871 ± 112,557 ops/s
>>
>>
>> After patch:
>>
>> Benchmark (size) Mode Cnt Score Error Units
>> ref.SliceToList.par_baseline 10000 thrpt 30 14793,373 ± 64,905 ops/s
>> ref.SliceToList.par_limit 10000 thrpt 30 13301,024 ± 1300,431 ops/s
>> ref.SliceToList.par_skipLimit 10000 thrpt 30 11131,698 ± 1769,932 ops/s
>> ref.SliceToList.seq_baseline 10000 thrpt 30 24101,048 ± 263,528 ops/s
>> ref.SliceToList.seq_limit 10000 thrpt 30 16872,168 ± 76,696 ops/s
>> ref.SliceToList.seq_skipLimit 10000 thrpt 30 11953,253 ± 105,231 ops/s
>> value.SliceToArray.par_baseline 10000 thrpt 30 25442,442 ± 455,554 ops/s
>> value.SliceToArray.par_limit 10000 thrpt 30 23111,730 ± 2246,086 ops/s
>> value.SliceToArray.par_skipLimit 10000 thrpt 30 17980,750 ± 2329,077 ops/s
>> value.SliceToArray.seq_baseline 10000 thrpt 30 66512,898 ± 1001,042 ops/s
>> value.SliceToArray.seq_limit 10000 thrpt 30 41792,549 ± 1085,547 ops/s
>> value.SliceToArray.seq_skipLimit 10000 thrpt 30 18007,613 ± 141,716 ops/s
>>
>>
>> I also modernized SliceOps a little bit, using switch expression (with no explicit default!) and diamonds on anonymous classes.
>
> Tagir F. Valeev has updated the pull request incrementally with four additional commits since the last revision:
>
> - More benchmarks
> - adjustSize -> exactOutputSize
>
> Co-authored-by: Paul Sandoz <paul.d.sandoz at googlemail.com>
> - adjustedLimit -> normalizedLimit
>
> Co-authored-by: Paul Sandoz <paul.d.sandoz at googlemail.com>
> - adjustSize -> exactOutputSize
>
> Co-authored-by: Paul Sandoz <paul.d.sandoz at googlemail.com>
I see your concern. I made some additional benchmarks and added them here. First, CountSized, which just gets the stream size without actual traversal. We can see how the performance changes depending on number of stream operations. I also added an optional type profile pollution that makes `exactOutputSize` virtual method polymorphic. Here's the results:
Baseline (The `count10Skip` test added just to ensure that patch works)
Benchmark (pollute) (size) Mode Cnt Score Error Units
count0 false 10000 avgt 100 15,648 ± 0,182 ns/op
count2 false 10000 avgt 100 31,252 ± 0,113 ns/op
count4 false 10000 avgt 100 47,683 ± 0,165 ns/op
count6 false 10000 avgt 100 64,417 ± 0,203 ns/op
count8 false 10000 avgt 100 80,813 ± 0,265 ns/op
count10 false 10000 avgt 100 101,057 ± 0,295 ns/op
count10Skip false 10000 avgt 100 497967,375 ± 5946,108 ns/op
count0 true 10000 avgt 100 18,843 ± 0,103 ns/op
count2 true 10000 avgt 100 33,716 ± 0,152 ns/op
count4 true 10000 avgt 100 49,062 ± 0,208 ns/op
count6 true 10000 avgt 100 66,773 ± 0,237 ns/op
count8 true 10000 avgt 100 82,727 ± 0,354 ns/op
count10 true 10000 avgt 100 104,499 ± 0,299 ns/op
count10Skip true 10000 avgt 100 501723,220 ± 6361,932 ns/op
Type pollution adds some near-constant ~2ns overhead to the non-patched version as well.
Patched:
Benchmark (pollute) (size) Mode Cnt Score Error Units
count0 false 10000 avgt 100 15,363 ± 0,086 ns/op
count2 false 10000 avgt 100 33,736 ± 0,138 ns/op
count4 false 10000 avgt 100 51,470 ± 0,205 ns/op
count6 false 10000 avgt 100 70,407 ± 0,262 ns/op
count8 false 10000 avgt 100 89,865 ± 0,262 ns/op
count10 false 10000 avgt 100 114,423 ± 0,363 ns/op
count10Skip false 10000 avgt 100 139,963 ± 0,550 ns/op
count0 true 10000 avgt 100 26,538 ± 0,084 ns/op
count2 true 10000 avgt 100 46,089 ± 0,191 ns/op
count4 true 10000 avgt 100 66,560 ± 0,315 ns/op
count6 true 10000 avgt 100 87,852 ± 0,288 ns/op
count8 true 10000 avgt 100 109,037 ± 0,391 ns/op
count10 true 10000 avgt 100 139,759 ± 0,382 ns/op
count10Skip true 10000 avgt 100 156,963 ± 1,862 ns/op
So indeed we have some performance drawback in patched version. Here's a chart:

I've calculated linear regression on (patched-baseline) times, depending on the number of ops. It's `y = 1.288x - 0.7078` for clean type profile and `y = 2.6174x + 6.9489` for polluted type profile. So, in the worst case, we have circa 2.6ns per operation plus 7ns constant overhead.
However, using Stream API without actually iterating the stream is very rare case. And if we iterate, the performance will be dominated by the number of iterations. I tried to model this case with SumSized benchmark (replacing count with sum, for 5 and 10 stream elements), but got very confusing results.
Baseline:
Benchmark (pollute) (size) Mode Cnt Score Error Units
sum0 true 5 avgt 100 126,425 ± 0,793 ns/op
sum2 true 5 avgt 100 195,113 ± 1,359 ns/op
sum4 true 5 avgt 100 304,111 ± 8,302 ns/op
sum6 true 5 avgt 100 414,841 ± 3,215 ns/op
sum8 true 5 avgt 100 507,421 ± 4,781 ns/op
sum10 true 5 avgt 100 633,635 ± 7,105 ns/op
sum0 false 5 avgt 100 45,781 ± 0,258 ns/op
sum2 false 5 avgt 100 86,720 ± 0,573 ns/op
sum4 false 5 avgt 100 195,777 ± 1,145 ns/op
sum6 false 5 avgt 100 291,261 ± 2,091 ns/op
sum8 false 5 avgt 100 376,094 ± 3,283 ns/op
sum10 false 5 avgt 100 492,082 ± 7,914 ns/op
sum0 true 10 avgt 100 127,989 ± 0,758 ns/op
sum2 true 10 avgt 100 219,991 ± 3,081 ns/op
sum4 true 10 avgt 100 374,148 ± 7,426 ns/op
sum6 true 10 avgt 100 557,829 ± 3,959 ns/op
sum8 true 10 avgt 100 698,135 ± 4,915 ns/op
sum10 true 10 avgt 100 904,851 ± 14,458 ns/op
sum0 false 10 avgt 100 43,861 ± 0,107 ns/op
sum2 false 10 avgt 100 105,049 ± 0,276 ns/op
sum4 false 10 avgt 100 294,639 ± 1,499 ns/op
sum6 false 10 avgt 100 439,340 ± 4,223 ns/op
sum8 false 10 avgt 100 577,025 ± 5,760 ns/op
sum10 false 10 avgt 100 729,391 ± 6,045 ns/op
Patched:
Benchmark (pollute) (size) Mode Cnt Score Error Units
sum0 true 5 avgt 100 68,466 ± 0,167 ns/op
sum2 true 5 avgt 100 107,240 ± 0,261 ns/op
sum4 true 5 avgt 100 209,469 ± 1,098 ns/op
sum6 true 5 avgt 100 300,873 ± 2,020 ns/op
sum8 true 5 avgt 100 378,654 ± 2,620 ns/op
sum10 true 5 avgt 100 473,769 ± 3,665 ns/op
sum0 false 5 avgt 100 49,435 ± 2,702 ns/op
sum2 false 5 avgt 100 96,237 ± 2,906 ns/op
sum4 false 5 avgt 100 195,196 ± 0,961 ns/op
sum6 false 5 avgt 100 286,542 ± 1,874 ns/op
sum8 false 5 avgt 100 371,664 ± 3,416 ns/op
sum10 false 5 avgt 100 457,178 ± 3,776 ns/op
sum0 true 10 avgt 100 69,223 ± 0,195 ns/op
sum2 true 10 avgt 100 120,507 ± 0,752 ns/op
sum4 true 10 avgt 100 291,328 ± 5,581 ns/op
sum6 true 10 avgt 100 439,136 ± 3,787 ns/op
sum8 true 10 avgt 100 569,188 ± 6,440 ns/op
sum10 true 10 avgt 100 709,916 ± 5,022 ns/op
sum0 false 10 avgt 100 46,347 ± 0,174 ns/op
sum2 false 10 avgt 100 109,131 ± 2,381 ns/op
sum4 false 10 avgt 100 296,566 ± 2,079 ns/op
sum6 false 10 avgt 100 430,852 ± 2,629 ns/op
sum8 false 10 avgt 100 562,795 ± 4,442 ns/op
sum10 false 10 avgt 100 716,229 ± 5,659 ns/op
Or, in graphical form:
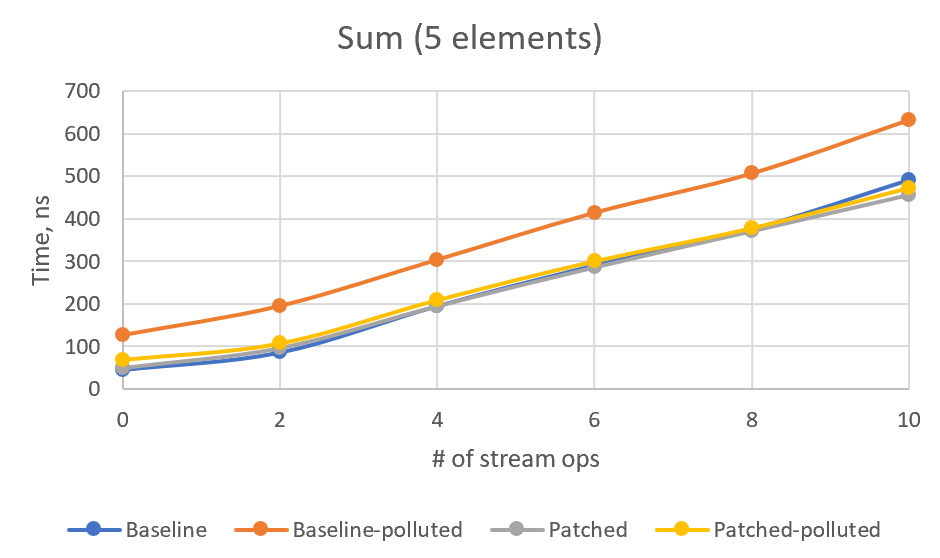
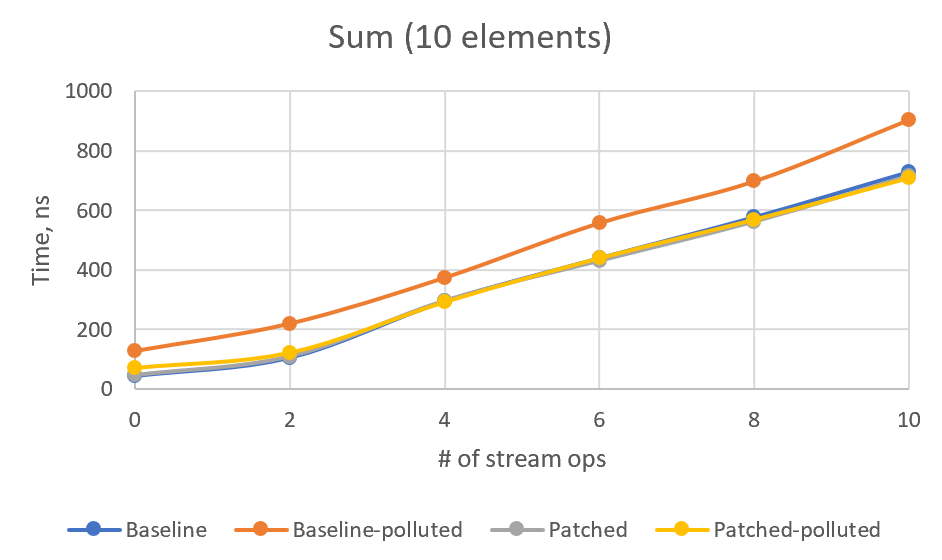
For some reason, non-patched polluted version is the slowest, and I cannot see any stable overhead in patched version. For 4+ intermediate ops, patched version numbers are always better than the corresponding non-patched ones. I would be glad if somebody explains these numbers or point to a flaw in this benchmark.
What do you think, @PaulSandoz? Is it acceptable overhead or should I experiment with the new Stream flag?
-------------
PR: https://git.openjdk.java.net/jdk/pull/3427
More information about the core-libs-dev
mailing list